Download data using filtering
https://gulfcitizenscience.org/data/ + organization's name
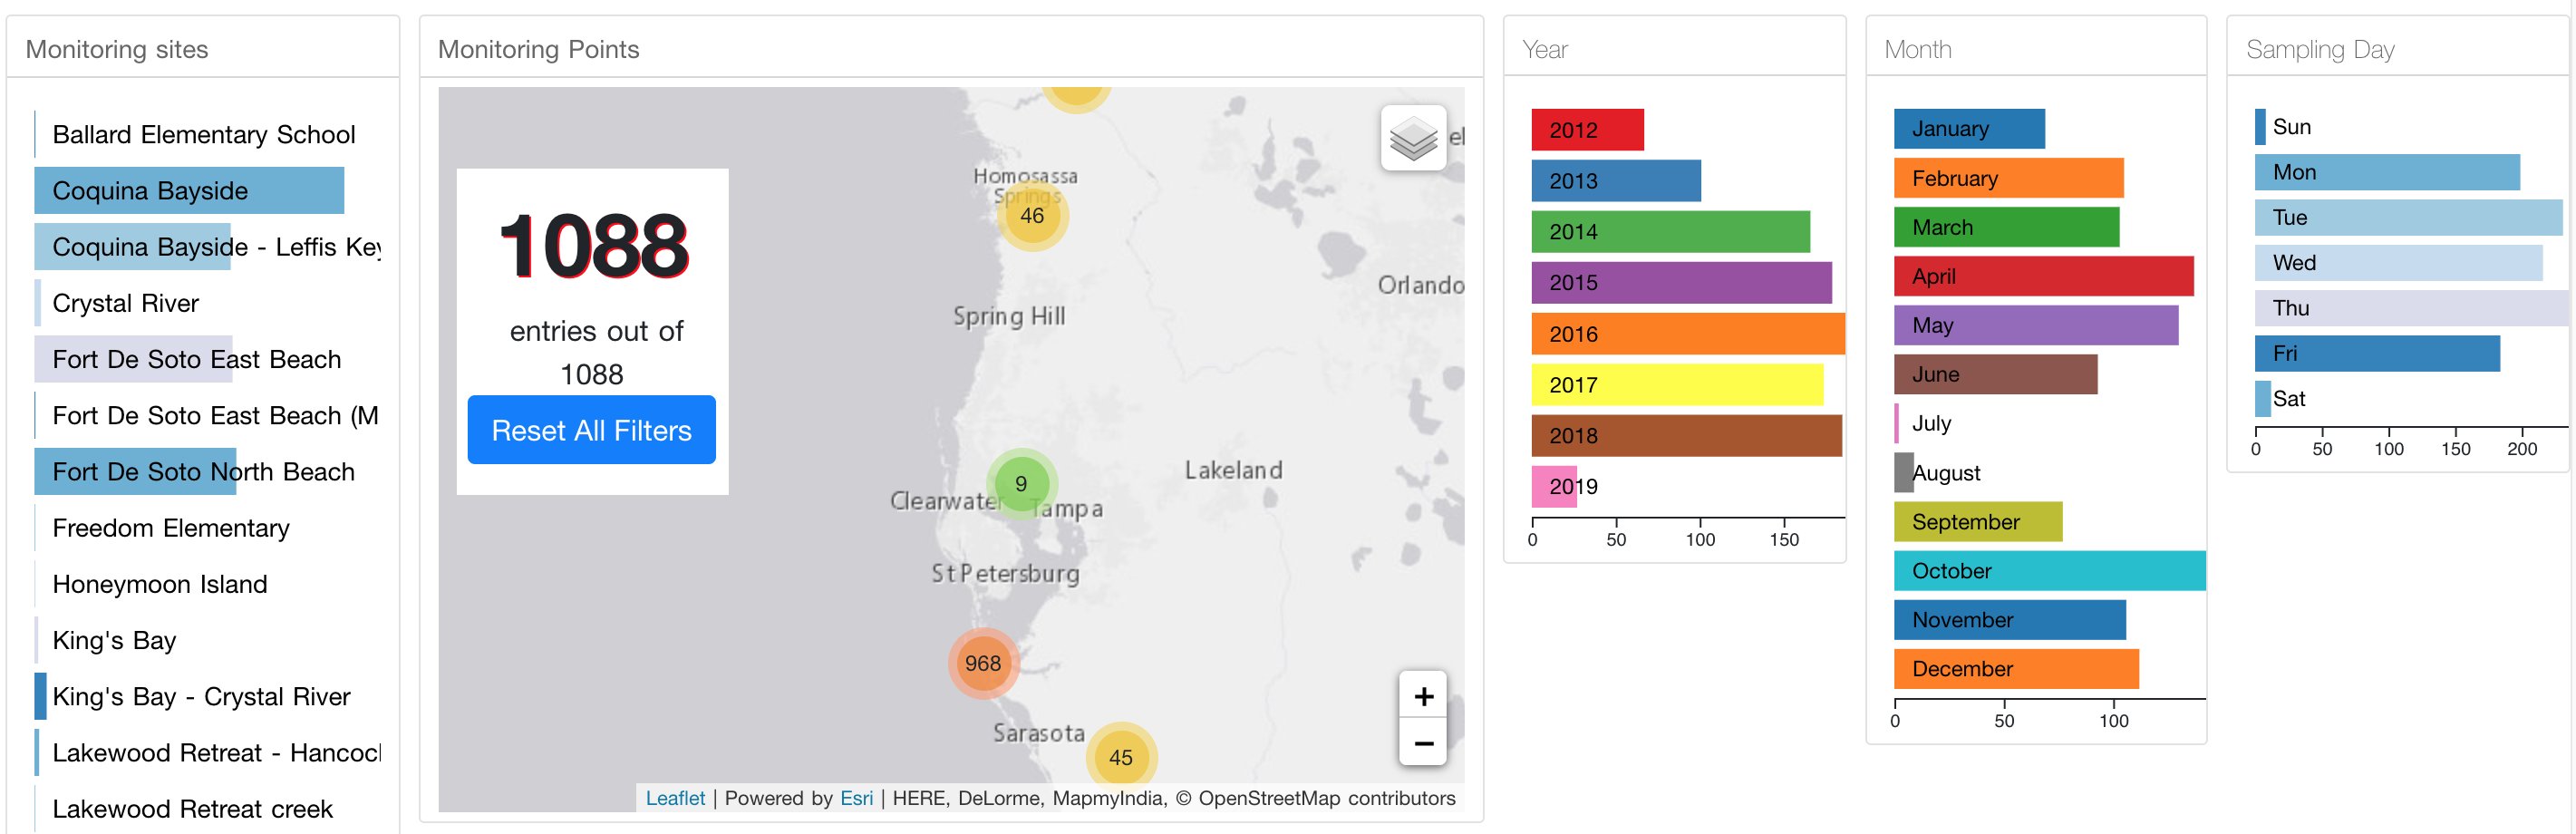
Each organization's data table page comes with multiple filtering sets such as year, month, weekday, and sites.
When you click a bar of bar chart, marker on a map and table will be updated accordingly.
For example, if you need data collected in May 2018, you click "2018" from the "Year" bar chart and "May" from the "Month" bar chart. The order does not matter. In Nature's Academy dataset, it should show 19.
The left side panel shows sampling sites grouped by location. When you click a bar on the panel, the map and data table will be updated and only show datasets on the sampling site.
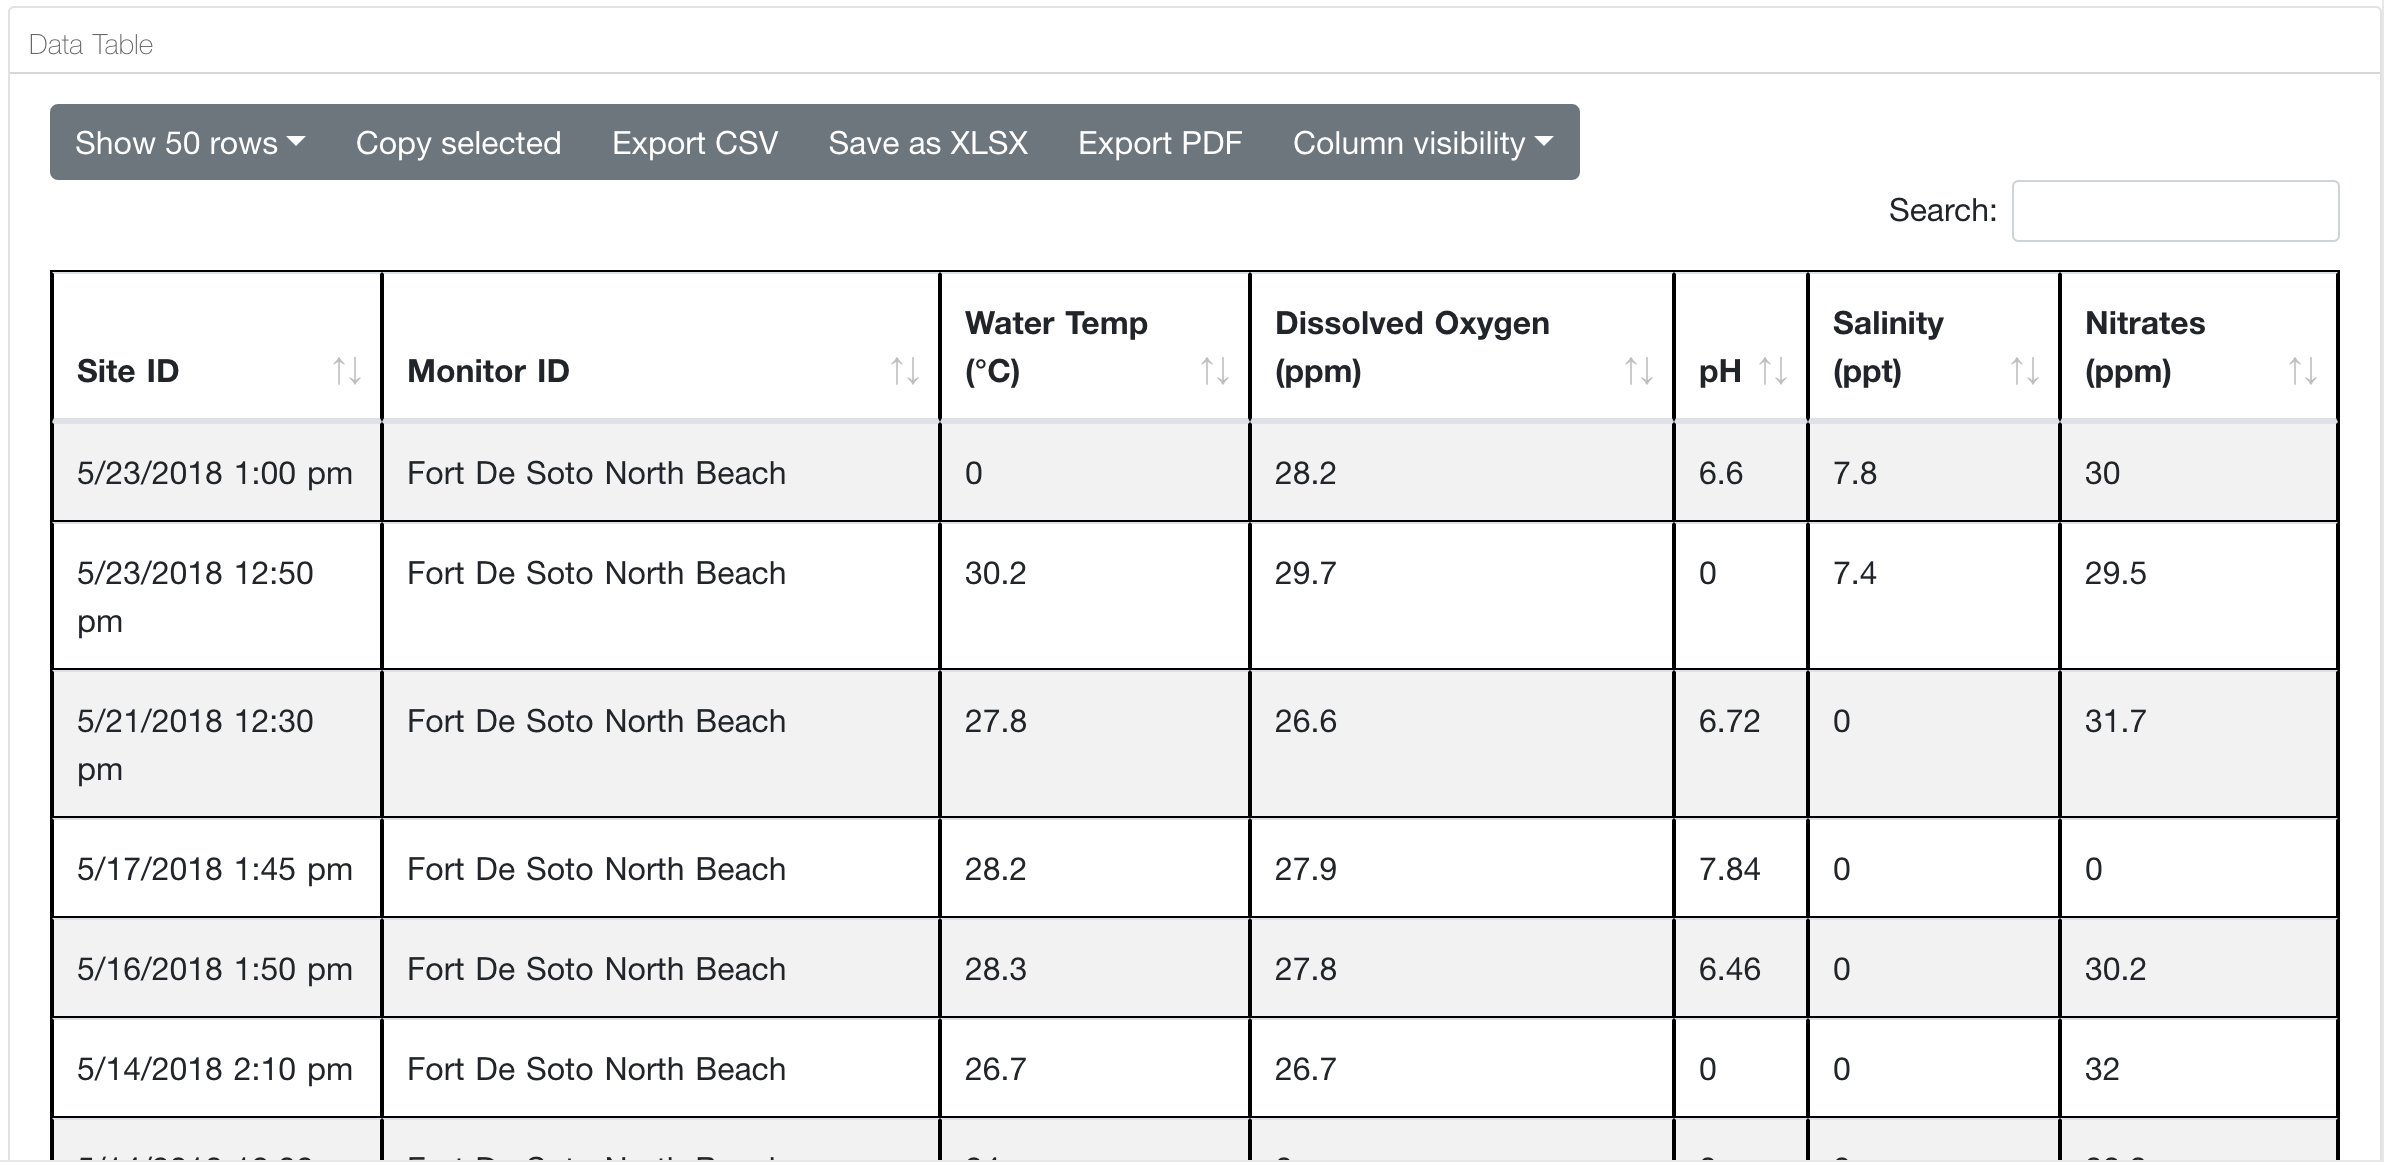
Even after filtering, if there are more than 50 entries, you should switch from "Show 50 rows" to "Show all" to download all datasets; otherwise, you get only 50 entries.
This setting applies to all other exporting functions (Copy selected, Export CSV, Save as XLSX, Export PDF). Either some columns are visible or not, all columns will be downloaded.